
FINANCIAL & KPI INTELLIGENCE

Better decisions start with trustworthy metrics.

When reports disagree, the real challenge is often definitions—not arithmetic. We help businesses reconcile data sources, establish consistent performance measures and reveal the drivers behind results.

WHAT THE NUMBERS MEAN

Different calculations can tell different stories

Illustrative synthetic dataset — not client performance

A simple illustration shows why aggregation matters. These figures come from an invented set of 18 segment-month records, not from a real business or an industry benchmark.

4.01%

Unweighted average

Mean of 18 row-level return rates.

4.66%

Pooled return rate

446 returned orders ÷ 9,578 total orders.

2.51%

Services sample

28 returned orders ÷ 1,116 orders in six synthetic rows.

The correct calculation depends on the business question and the units being compared. A properly defined metric must explain its numerator, denominator and reporting period.
HOW WE WORK

From raw records to consistent reporting

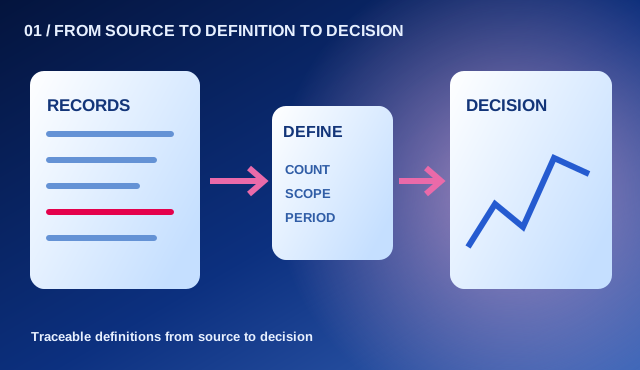
Records organized through a definition and decision process
01

Define

Agree on the business question and the unit of measurement.

02

Reconcile

Trace definitions, sources, exclusions and inconsistencies.

03

Explain

Present comparable metrics and make limitations visible.

WHAT YOU CAN USE

A shared definition makes performance actionable

Illustrative metric definition framework
MeasureDefinition to establishBusiness decision supported
RevenueRecognition period, entity and exclusionsUnderstand sales performance.
Customer retentionEligible starting customers and cancellation rulesIdentify sustainable growth.
UtilizationAvailable capacity versus billable activityAssess staffing and delivery efficiency.
Operating marginIncluded costs, allocations and time periodInterpret profitability consistently.

The output is a traceable metric framework, supported by a clear explanation of how figures should be interpreted. The appropriate metrics depend on the business and its data.

WHY IT MATTERS

Know which figures you can rely on

Source consistency

Identify differences between systems and reporting periods.

Performance drivers

Separate genuine operational changes from changes in measurement.

Decision visibility

Understand which figures are dependable—and what needs checking.

THE NEXT QUESTION

Which numbers actually explain your business?

Bring us the decision you're facing. We can help identify the relevant evidence, compare practical options, and establish clear next steps.

Discuss your project